Exception Based Operations for Warehousing
Problem:
Our client is a medium-scale warehouse with operations spread across Goa and neighbouring states. They needed help with monitoring temperature, rh, and a bunch of other parameters of the units where they store their client's products. As they scaled, it became imperative for them to provide effective reporting to their clients regarding these params. Although they had an existing solution provided by their existing vendor, it did not produce any meaningful insights for the data that was being collected.
Solution:
We introduced them to GENESIS, our cloud based IoT platform used for remote monitoring of Warehousing facilities such as theirs. They could now monitor multiple facilities through our platform using exception-based dashboards. The dashboard effectively visualized information that helped our client find what they needed with minimal effort. It provided them access to reports in PDF or xlsx format for each metric along with near real time alerts.
Architecture
The architecture of GENESIS platform for our client is outlined below-
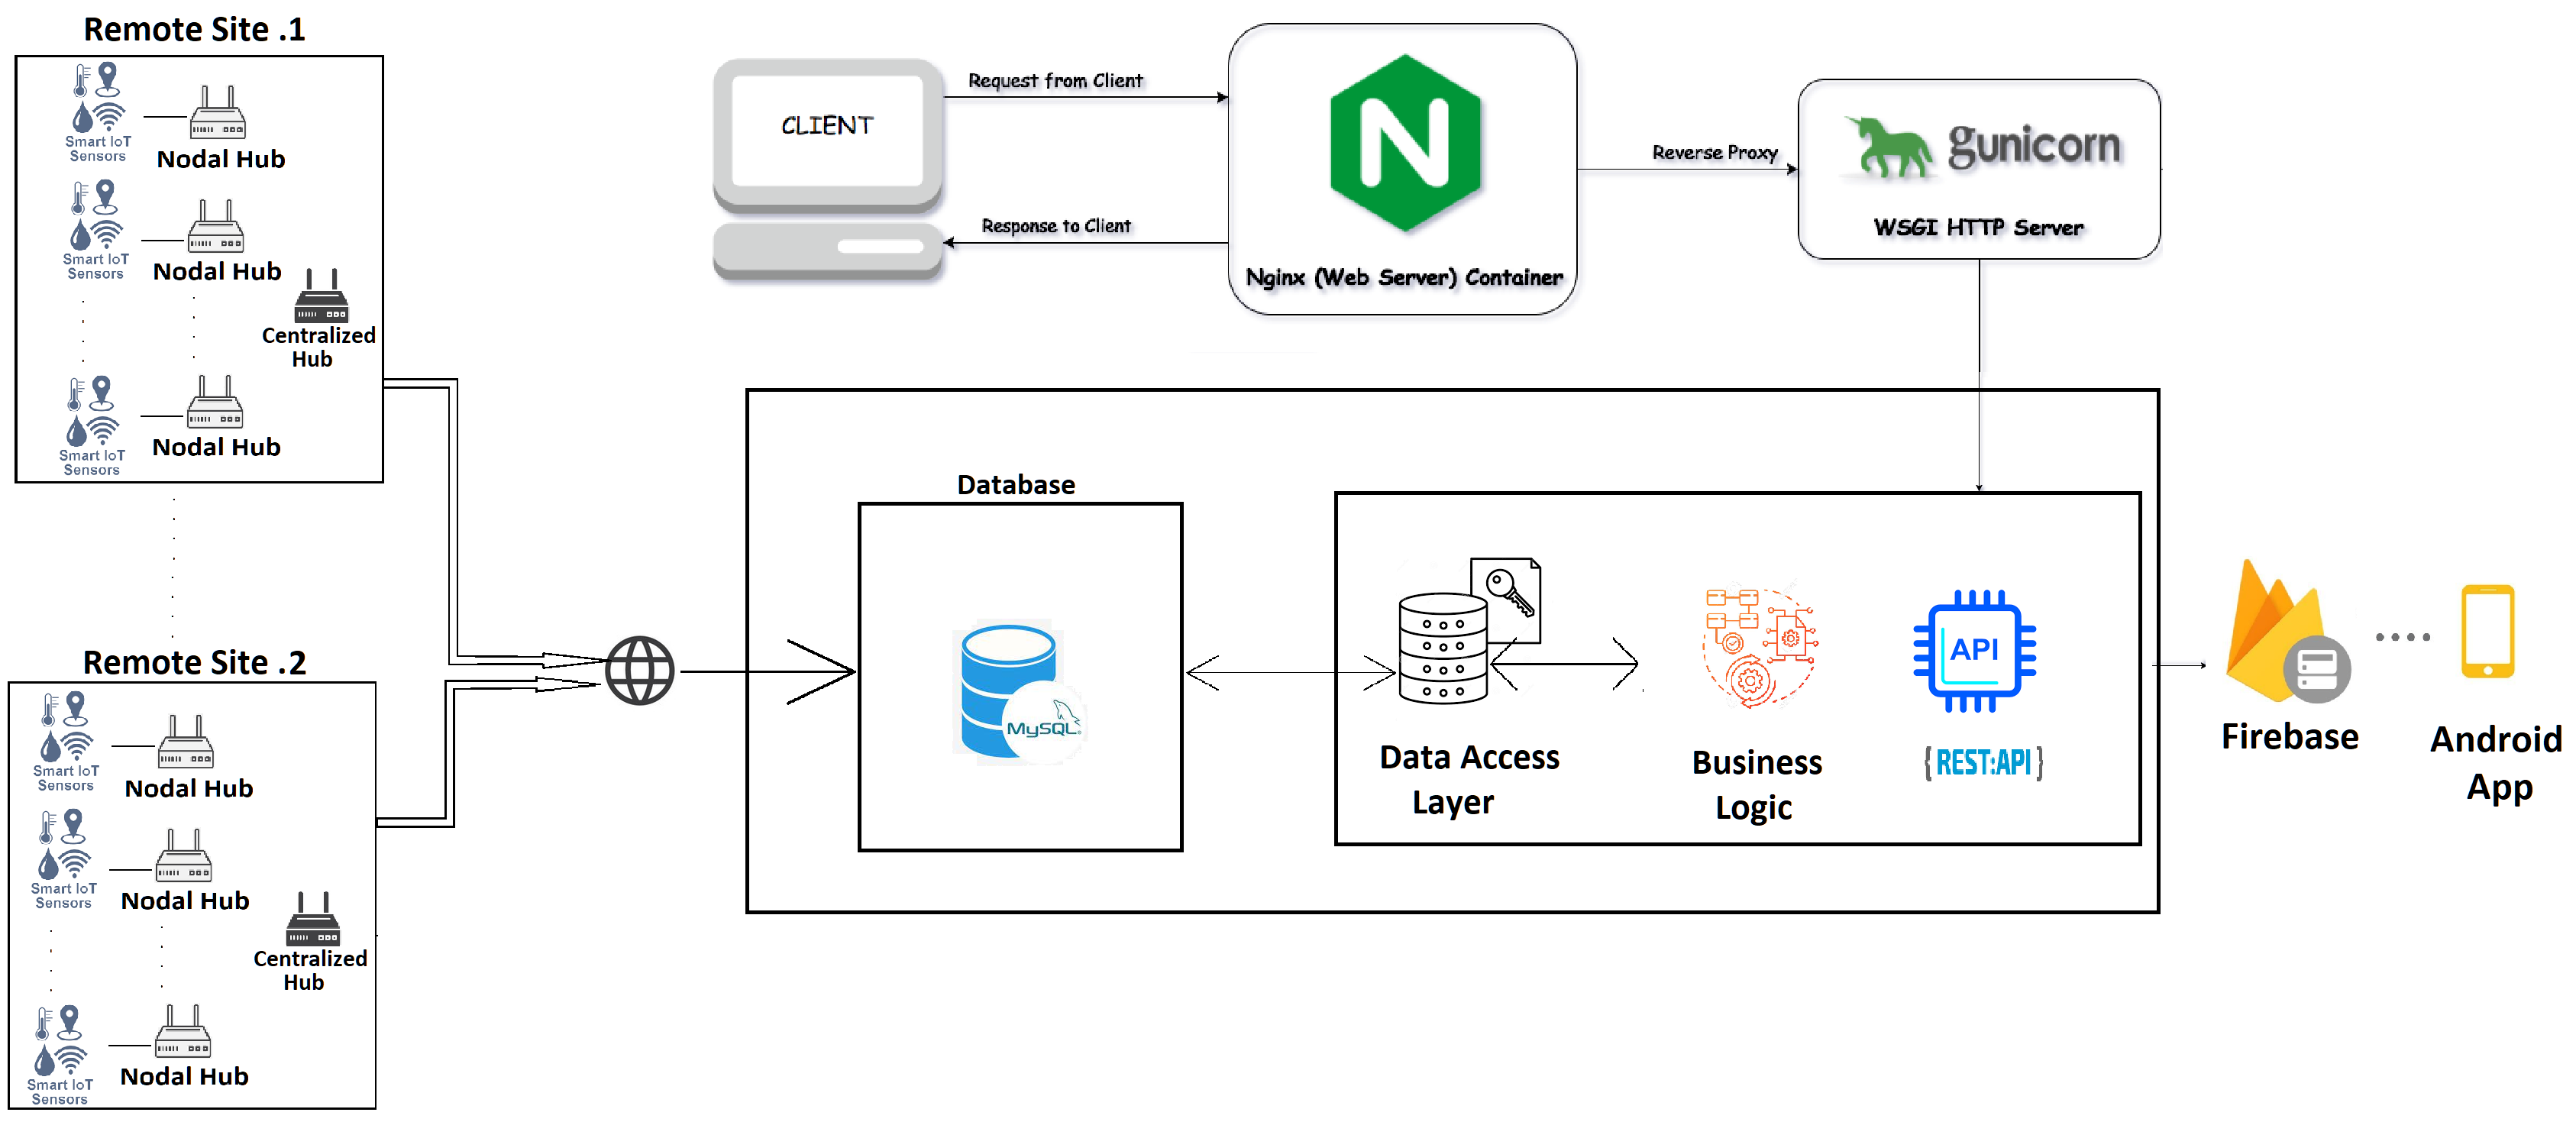
It is broken down into 4 main blocks briefly explained below.
- Data Acquisition – sensor setup.
- Genesis Server - Database & Business logic
- Client Application.
- Push Notification Service.
Data Acquisition: Data is collected from on-site sensors to collect various data points. In the current configuration the client facility is divided into units; each unit having its own nodal hub. These sensors are connected to their nodal hubs via wired or wireless communication depending on the type of sensor. Each nodal hub communicates with the centralized hub over Modbus 2 wire communication line. The centralized hub then sends sensor information over the internet to the Genesis Server (Database).
Genesis Server: The main application itself has 2 main components-
- MySql database- stores all the raw and processed data from the different sensors installed on-site
- Genesis Application Server- This Python Flask framework-based app contains logic to aggregate data at various levels for dashboards and reports using Rest APIs.
Client Application: The users interact with Genesis using web browsers or through the Android app.
Push Notification: This component sends Push notifications to the client application using the Firebase service. This helps in serving active notifications/alerts to the users regarding certain regular/emergency events.
Web Application
The following are details of various entities of the GENESIS web application and some screenshots of the application that was used for our warehousing client.
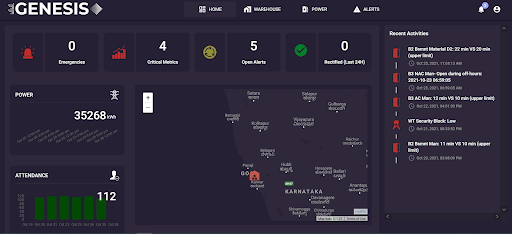
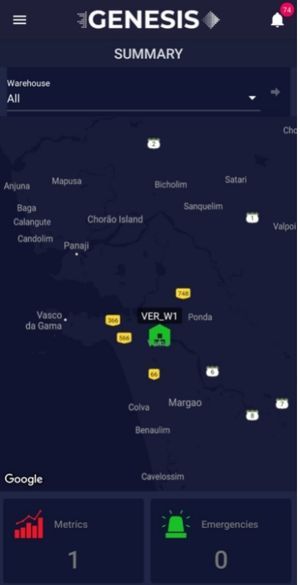
Landing page- This gave our client a snapshot of the global (for a multi-location setup) state of their facility being monitored with colour coded widgets(red/green/grey) along with a summary of the latest important events across locations.
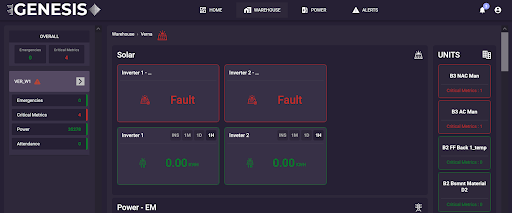
Warehouse Page- This gave our client a summary of specific locations. Every location has various units which house the sensors within themselves. Certain sensors can also be tagged at the warehouse/location level, which will show up on this page. As can be seen, the cards are colour coded indicating which metrics/units are normal/breaching control thresholds.
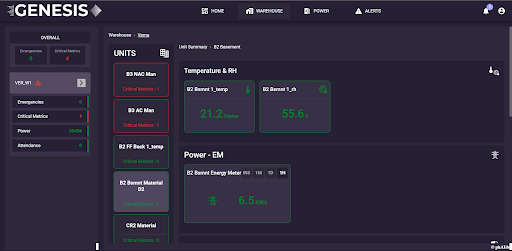
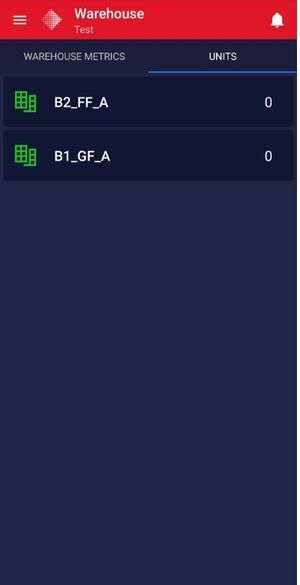
Unit Page- On drilling into the units in the previous view our client could reach the individual sensors (which show up as cards) deployed in that unit.
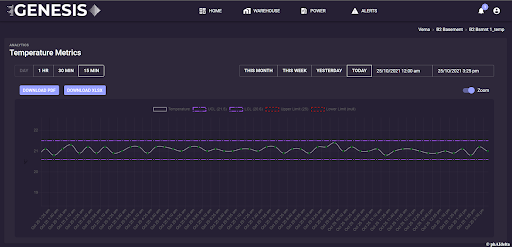
Reporting Page- With just one click of the sensor card, our client could access the reporting/charts page. Here they could see the control limits and user defined senor thresholds. They could extract reports for any of the predefined date ranges or select their own date range along with pre-fixed aggregation periods (day/hour/30 mins/15 mins). Exports were available for them in xlsx and pdf.
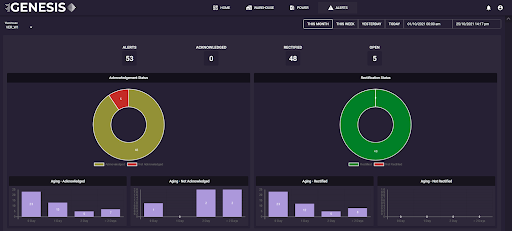
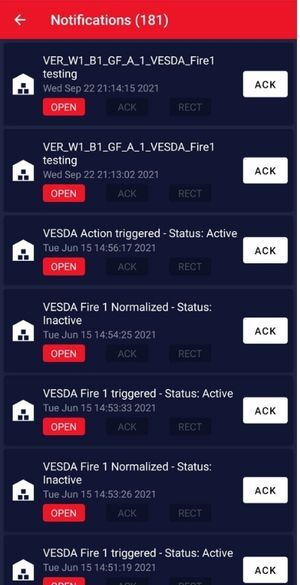
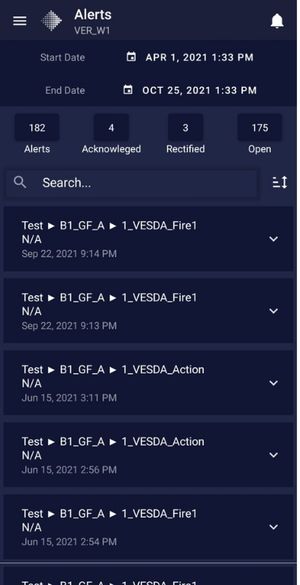
Alerts Analytics- This is a unique page that provided our client with some insights into the way alerts are being handled by the people handling their facility. It classified the alerts into Open/Acknowledged/Rectified alerts. Through the workflow built around the alerts, those in charge could take remedial actions to bring the metrics back in control. The analytics also gave information about the ageing of these alerts based on when the users acknowledged/closed them.
Android app:
These screenshots are a subset of the features in the web app-
Conclusion:
By consistently using our platform, our client was able to substantially increase the effectiveness of their product management. Being able to catch breaches early and implement required changes in their units, they were able to ensure that their client’s products remained undisturbed. The unique insights that our asset management software GENESIS offered, significantly increased their efficiency and thereby productivity.